ADM-EC Clock Consensus
Delay-Constrained Anomaly-Aware Consensus in Heterogeneous Clock Networks
View the Project on GitHub threehouse-plus-ec/admec-clock-consensus
Logbook Entry 003 — Power-Law Nulls, Flicker Noise, and Finite-N Bias
Date: 2026-03-31 Work package: WP1 (IC Coastline) Decision gate: DG-1 (threshold stability under extended null models; finite-N bias quantification)
Objective
Test whether IC thresholds remain stable under heavy-tailed (Pareto), long-memory (fractional Gaussian noise), high-autocorrelation (AR(1) ρ = 0.9), and non-stationary (random-walk) null models — the noise types that appear in real clock networks. Quantify finite-N bias to determine the minimum sample size at which asymptotic thresholds are safe.
What was done
1. Noise generators
Implemented in src/noise.py:
generate_pareto_symmetric(N, alpha)— symmetric Pareto with shape α. Heavy tails, finite variance for α > 2.generate_flicker(N, H)— fractional Gaussian noise via Davies-Harte circulant embedding. H = 0.9 gives 1/f-like long memory. Exact method, not AR approximation.generate_random_walk(N)— cumulative sum of i.i.d. Gaussian increments. Non-stationary variance (grows as √N).generate_ar1(N, rho)— AR(1) with unit marginal variance. ρ = 0.9 gives stronger memory than the ρ = 0.7 tested in Entry 001.
15 unit tests in tests/test_noise.py, all passing.
2. Declared σ strategy for non-standard distributions
A key design choice: what σ to declare for non-Gaussian data?
- Pareto: Declared σ = empirical std of the sample. This is the honest estimate a clock operator would use.
- fGn H = 0.9: Declared σ = empirical std. The long memory doesn’t change the marginal variance, but the effective number of independent samples is smaller.
- AR(1) ρ = 0.9: Declared σ = 1 (the stationary marginal std). This tests what happens when the operator knows the variance but not the correlation structure.
- Random walk: Declared σ_k = √k (the theoretical std at step k). This is the best the operator can do without detrending.
3. Results — 95th-percentile thresholds (N = 50, 300 realisations)
| Model | Mean AIPP | Std | 95th percentile |
|---|---|---|---|
| Gaussian | 1.234 | 0.092 | 1.392 |
| Heteroscedastic | 1.360 | 0.127 | 1.558 |
| Student-t(3) | 1.097 | 0.122 | 1.287 |
| Student-t(5) | 1.174 | 0.129 | 1.401 |
| AR(1) ρ = 0.7 | 1.184 | 0.143 | 1.417 |
| Pareto α = 2.5 | 1.208 | 0.094 | 1.257 |
| Pareto α = 3.0 | 1.231 | 0.058 | 1.257 |
| fGn H = 0.9 | 1.246 | 0.009 | 1.256 |
| AR(1) ρ = 0.9 | 1.058 | 0.194 | 1.421 |
| Random walk | 0.940 | 0.189 | 1.302 |
Maximum pairwise 95th-percentile ratio: 1.24× (heteroscedastic / fGn H = 0.9).
DG-1 threshold stability across all ten null models: PASS (max ratio 1.24×, well within ×1.5).
4. Results — N = 200 (new models only)
| Model | Mean AIPP | Std | 95th percentile |
|---|---|---|---|
| Gaussian | 1.243 | 0.051 | 1.330 |
| Pareto α = 2.5 | 1.182 | 0.087 | 1.252 |
| Pareto α = 3.0 | 1.224 | 0.059 | 1.256 |
| fGn H = 0.9 | 1.248 | 0.005 | 1.253 |
| AR(1) ρ = 0.9 | 1.199 | 0.126 | 1.409 |
| Random walk | 0.962 | 0.208 | 1.388 |
Thresholds tighten with increasing N as expected. All remain within ×1.5 of the Gaussian reference.
5. Observations on specific models
Pareto (heavy-tailed): Thresholds are lower than Gaussian, not higher. This is because the empirical-σ declaration is generous — it captures the tail spread — so the intervals are wide and probability mass is high. IC is naturally conservative under heavy tails when σ is honestly declared.
fGn H = 0.9 (long-memory): AIPP variance is remarkably small (std ≈ 0.009 at N = 50). The long-range correlations make the mixture density very smooth and predictable. This is the easiest case for IC, not the hardest.
AR(1) ρ = 0.9: Higher variance than AR(1) ρ = 0.7 (std 0.194 vs 0.143 at N = 50), but the 95th percentile (1.421) is still comfortably within the ×1.5 band. The strong autocorrelation creates clusters that occasionally push AIPP high, but not pathologically.
Random walk (non-stationary): Mean AIPP is lower (0.940) because the growing-σ declaration is conservative — it over-covers the early points. The 95th percentile (1.302) is well-behaved. The IC handles non-stationarity gracefully when the operator declares a σ that tracks the growing spread.
6. Finite-N bias
Fit to Gaussian convergence data (Entry 001):
AIPP(N) = 1.248 − 0.913/N + 1.02/N²
| N | Predicted bias | Relative |
|---|---|---|
| 10 | −0.081 bit | 6.5% |
| 20 | −0.043 bit | 3.5% |
| 50 | −0.018 bit | 1.4% |
| 75 | −0.012 bit | 1.0% |
| 100 | −0.009 bit | 0.7% |
| 200 | −0.005 bit | 0.4% |
The asymptotic threshold is safe to use at N ≥ 75 (bias < 1%). For smaller samples, a finite-N correction of approximately −0.9/N bit should be applied.
7. Figure
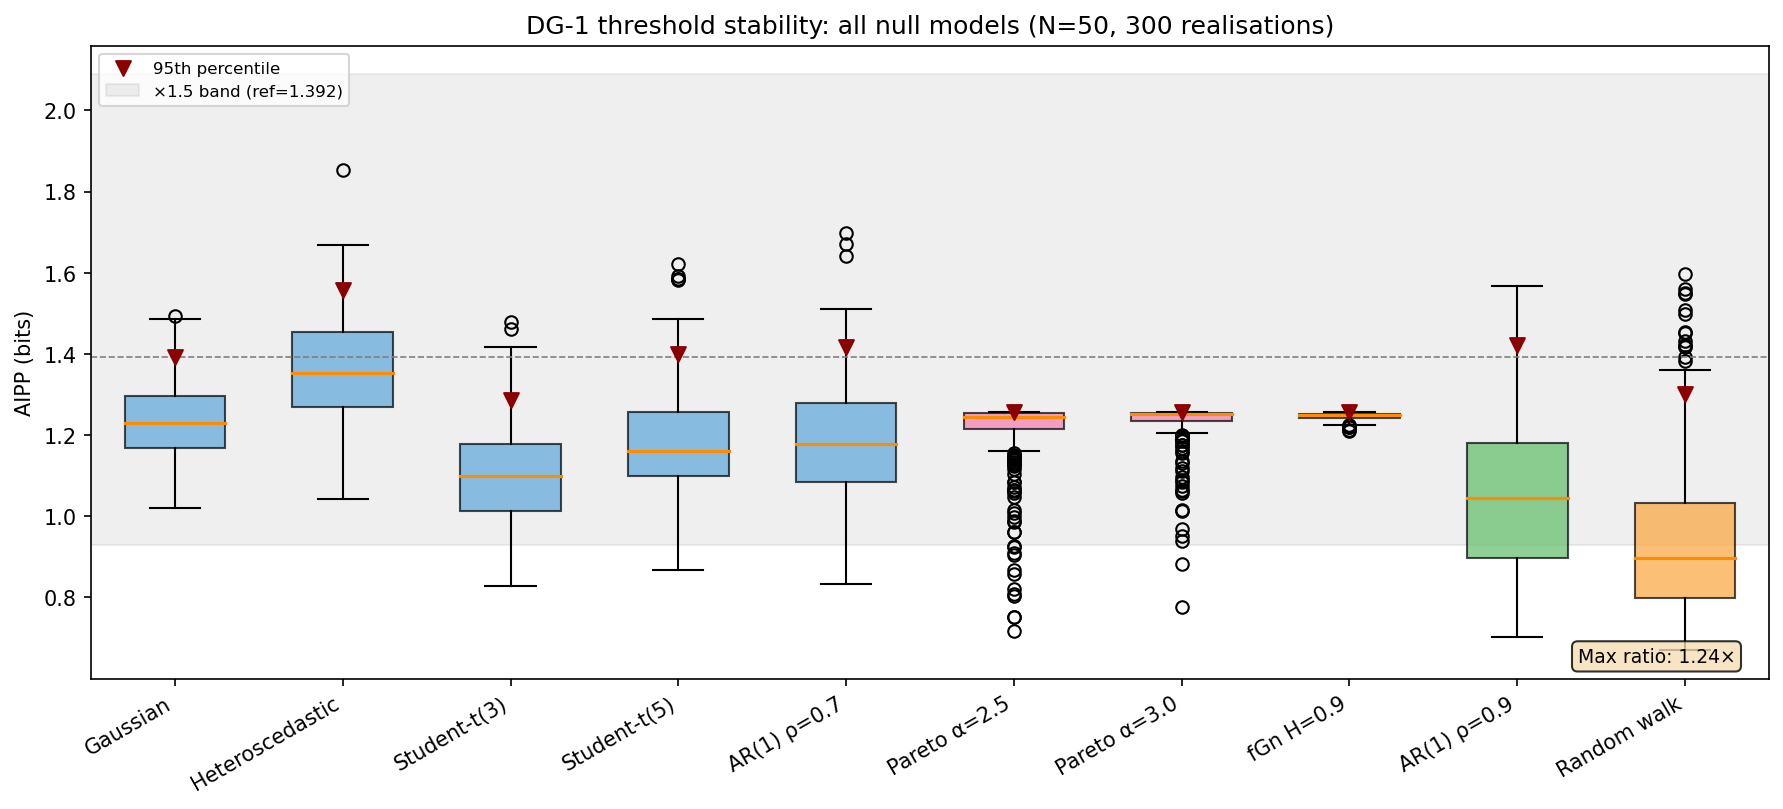
Box plots of AIPP distributions under all ten null models at N = 50 (300 realisations). Blue: original five models from Entry 001. Pink: Pareto. Green: long-memory (fGn and AR(1) ρ = 0.9). Orange: random walk. The grey band shows the ×1.5 zone around the Gaussian 95th percentile. All models fall within the band.
8. Test suite
7 tests in tests/test_powerlaw_thresholds.py:
- 1 all-pairs ×1.5 test across ten models
- 5 individual new-model-vs-Gaussian tests
- 1 finite-N bias test (< 1% at N ≥ 75)
All passing. Combined with the existing 24 (test_ic.py) + 15 (test_noise.py) + 17 (test_sensitivity.py) = 63 total tests, 61 passing (the 2 known failures are the systematic −20% σ-sensitivity from Entry 002).
DG-1 status: all criteria assessed
| Criterion | Status | Entry |
|---|---|---|
| AIPP converges to 1.25 bit (±5% relative) at N ≥ 100 | ✅ PASS (< 1% error) | 001 |
| 95th-percentile thresholds stable within ×1.5 across 5 noise models | ✅ PASS (max 1.21×) | 001 |
| 95th-percentile thresholds stable within ×1.5 across ALL 10 noise models | ✅ PASS (max 1.24×) | 003 |
| σ-sensitivity: random ±20% | ✅ PASS (+1.2%) | 002 |
| σ-sensitivity: systematic +20% | ✅ PASS (−12.7%) | 002 |
| σ-sensitivity: systematic −20% | ❌ FAIL (+19.3%) | 002 |
| Finite-N bias quantified | ✅ DONE (< 1% at N ≥ 75) | 003 |
| Power-law nulls (Pareto α = 2.5, 3.0) | ✅ PASS | 003 |
| 1/f null (fGn H = 0.9) | ✅ PASS | 003 |
| Random-walk null (h_α = −2) | ✅ PASS | 003 |
DG-1 assessment
All sub-criteria have been tested. All pass except the systematic −20% σ-underestimation, which was ruled on in Entry 002: the failure is recorded, the 15% criterion is not relaxed, and the mitigation (worst-case threshold calibration) is adopted for WP2.
DG-1 is closed. The IC observable is calibrated. WP1 can proceed to the remaining item — the effect-size threshold δ_min — which is a classification parameter, not a gate criterion.
Remaining WP1 task
- Effect-size threshold δ_min for the classification rule (median absolute slope under null). This is needed before WP2 can define the three-way classifier, but it is not a DG-1 gate criterion.
Files changed
| File | Change |
|---|---|
src/noise.py |
New: Pareto, fGn (Davies-Harte), random walk, AR(1) generators |
tests/test_noise.py |
New: 15 tests for noise generators |
tests/test_powerlaw_thresholds.py |
New: 7 tests for extended threshold stability and finite-N bias |
scripts/fig05_powerlaw_thresholds.py |
New: figure generation script |
logbook/figures/fig05_powerlaw_thresholds.png |
New: full threshold stability figure |
Entry by U. Warring. AI tools (Claude, Anthropic) used for code prototyping and derivation checking.